Want to boost profits? It's all about mastering your product mix and menu engineering. Every business out there has a unique blend of products or services. But here's the kicker: survival hinges on meeting demand. Many managers fall into the trap of adding items willy-nilly until it's too late. Ever wondered why there's a labor shortage? Picture this: restaurants selling T-shirts and jewelry alongside gyros. Sounds bizarre, right?

How to boost Profit using Product Mix & Menu Engineering
Enter product mix analysis, a game-changer since the '70s, pioneered by the Boston Consulting Group (BCG) with their Four Quadrants. Fast forward to '82, and at Michigan State University Michael Kasavana, Ph.D., and Donald J. Smith unveiled Menu Engineering, seamlessly merging product mix analysis with BCG's framework. Big players like McDonald's, Panera Bread, and Pizza Hut swear by it.
The product mix offered by any given Business is vital to success, kept unchecked it leads to failure.
- Too many items drain resources, leading to unnecessary costs like real estate, labor, and inventory.
- And watch out for Product Cannibalization—it's a real threat.
- On the flip side, too few offerings mean missed opportunities and lost profits.
Now, let's talk terminology. When we mention units sold, volume, popularity, or demand, we're talking about the same thing.
But here's the kicker: around 80% of the time, when we ask owners about their product mix, we get a laundry list. The savvy ones give us items with demand figures. The pros? They hand over lists with units sold and selling prices. Food costs? Rarely provided, and when they are, they're often ballpark figures. But hey, it's a start. For competitive analysis and strategy development, accuracy is key, especially with food costs.
Here's the golden rule: prioritize demand over margin. Why? Because demand is the cornerstone of branding and sets the stage for everything else. Profit? It's the endgame, a result of nailing demand, margins, and menu engineering. So, ready to take your profits to the next level? Stay tuned.
What is a Menu Engineering?
Restaurant Menu Engineering is like the secret sauce of maximizing restaurant profits. It's a slick strategy that falls under the umbrella of product mix analysis, leveraging operational data to make savvy decisions. But here's the kicker: it's not about ramping up sales; it's about slashing costs and beefing up that bottom line.
It is important to understand that Menu Engineering is a strategy to cut costs and boost profit. But it is NOT designed to increase sales.
Increasing sales is a different categorical strategy by itself. Upselling, cross-selling, and menu layout are some of the tools to increase sales. For instance, we tell clients to train their crew to offer deserts only after the order is finalized.
So, what's the deal with menu engineering? Think of it as a behind-the-scenes wizardry, where the layout and pricing of your menu are strategically orchestrated to entice diners without them even realizing it. Take desserts, for example. Ever notice how they're often offered after you've already ordered your main course? A well-presented dessert is difficult to resist. Sneaky, right? But effective.
Here's the playbook: front page, appetizers and mains. Second page? That's where the desserts lurk. It's all about guiding your customers through a tantalizing journey, one course at a time -Smooth, and Stealthy.
Looking for low-hanging fruits to cut costs? Then "menu engineering" should be on your top priority basket list!
But menu engineering isn't just some textbook theory you skim through and forget. It's a hands-on, trial-and-error process that marries item cost, units sold, and price point into a beautiful dance of supply and demand. And let's talk contribution margin. It's not about individual profits; it's about riding the wave of demand to maximize overall profit. Selling five (5) items with a $1 margin each beats selling two (2) items with a $1.50 margin, any day. Following demand is exactly at the heart of listening to the customer.
Before we explain further this "magic" formulation, we need to explain some psychological customer studies and powerful findings.
Limit Offering Choices (focus on profitable items)
Now, onto the psychology bit. Ever heard of the Paradox of Choice? It's the idea that too many options can actually paralyze decision-making. That's why streamlining your menu offerings can work wonders. Less is indeed More, my friend. So reduce offerings - You read it right!
Learning to choose is hard. Learning to choose well is harder. And learning to choose well in a world of unlimited possibilities is harder still, perhaps too hard.
– Barry Schwartz in his book The Paradox of Choice
Think about it: fewer buttons on a website (website conversion optimization), one sleek phone design instead of a dozen variations—simplicity sells. And in the world of menu engineering, simplicity means bigger profits. Ready to trim the fat and amp up your earnings? Menu engineering is your golden ticket.
Cas in point: did you notice that Samsung has several phone variations while Apple has one and only one phone design?
Apple Phones
- iPhone
Samsung Phones
- Galaxy S
- Galaxy A
- Galaxy Note
- Galaxy Ultra
- Galaxy Flip
- Galaxy Z Fold
Real-Life simple Menu Engineering case study
The best and easiest explanation of menu engineering is in the 20 oz Soda simple experiment. This is a real-life consulting service experiment we run for one of our customers. It has the Before and After numbers to measure performance. We run an experiment on 20 Oz beverages for a pizzeria. Beverages are commodities that are constant in flavor, and demand - sensitive only to cost.
Let's dive into a real-world case study that breaks down menu engineering in its simplest form: the 20 oz Soda Experiment. Picture this: a pizzeria facing the challenge of optimizing its beverage offerings. Sounds mundane, right? But the results are anything but.
Before we worked our magic, the lineup was pretty standard: 20 oz soda there was 6 flavors, nothing too fancy. But here's where it gets interesting. We ran the numbers, crunched the data, and pinpointed the sweet spot for maximizing profits. It's all about fine-tuning that product mix to hit the bullseye.
Product mix Before Menu Engineering Consulting
Before our menu engineering intervention in Q4 of 2017, the pizzeria offered a whopping six soda flavors. But here's the kicker: two (2) of them, the 20 oz Diet options, were absolute duds. Our matrix analysis revealed these underperformers, prompting us to nix them from the menu.

The matrix showed 2 Dogs the 20 Oz Diet offerings, we must stop selling these items.
The owner made some eye-opening observations. By ditching Sprite, they freed up space, downsizing from three (3) refrigerators to just two (2). Not to mention the hefty savings equipment maintenance. Oh, and let's not forget the headache of premature expiration—those diet sodas were notorious for going bad before they even hit the shelves.
Product Mix After Menu Engineering Consulting
Here is the product mix post-improvement Q4 of 2018, notice there are ONLY 3 flavors offered.
With a leaner menu in place, boasting just three soda flavors, the pizzeria saw a remarkable uptick in profitability. Despite slightly higher supply costs, the contribution margin soared from $4,380 to $4,727. Translation? An 8% profit boost. Sure, it fell short of our 15% target, but hey, a win's a win.
This case study underscores a fundamental truth: less is often more when it comes to menu engineering. By trimming the fat and focusing on high-demand items, you can unlock untapped profit potential. And for this pizzeria, the proof was in the soda—literally.
| Before Optimization | After Optimization | |
|---|---|---|
| Profit | $4,380 | $4,727 |
| Products | 6 | 3 |
| Fridges | 3 | 2 |
| Sales | $6,780 | $7,958 |
| Costs | $2,399 | $3,230 |
Boom!
High-five for nailing that Product Mix optimization! We've seen some serious wins across the board.
- Take a tire company we worked with—they slashed a cool $73,000 by kicking a sluggish tire brand to the curb. And that's just the tip of the iceberg.
- A mid-size retail chain? We steered them towards better-performing battery brands, pocketing a sweet $129,000 in savings. Talk about a win-win
Now, here's the kicker: you can rock the menu engineering game too. Too slammed to tackle it yourself? No sweat. Shoot us a message, and we'll whip up a quote faster than you can say "profit boost."
But here's the thing: optimization isn't a one-and-done deal. It's a journey, a continuous quest for improvement. That means keeping a finger on the pulse of your product lineup. When demand hits a plateau, it's time to shake things up with fresh offerings.
Sure, new products might start off slow, chilling in the "dogs" corner of the BCG quadrant. But hey, Rome wasn't built in a day. The key? Make 'em stand out, give 'em that competitive edge. And remember, a little cannibalism ain't so bad if it means long-term profitability. But if a new product's crickets, don't hesitate to cut it loose. Adaptation is the name of the game, my friend.
How to do Menu Engineering the easy way
Menu engineering isn't rocket science—it's a must-have tool for any food business, plain and simple. And guess what? The data you need is right there in your POS system, waiting to be unleashed.
1. Compile Your Data No need to reinvent the wheel. Just gather and update your existing data into a snazzy executive dashboard. Say goodbye to guesswork and hello to data-driven decisions.
Menu Engineering Categories
Let's break it down into four easy-peasy quadrants: As described earlier, menu engineering links demand with price and costs. Once you finish coupling price, demand, and costs, you need to classify these items into one of the 4 quadrant categories (Star, Puzzle, Horse, and Dog).
Stars: High Demand & High Margin.
Think of Stars as your menu's shining superstars. They're hot sellers with killer margins. Keep 'em front and center, no need for fancy promotions.
As the name implies, Stars are high profit, high popularity items. Relatively cheap to make, and customers can’t get enough of them - demand. These items must be extremely visible, top position on your menu, or a focal point with outstanding contrast and a quick call to action. These items must be kept consistent with no experimental variation. Should they be in advertising campaigns? Depends on your business goal and strategy but usually No —they're already fan favorites.
Puzzles: Low Demand & High Margin.
Puzzled by why these items aren't flying off the shelves? It's all about cracking the code. Puzzles are the items on your menu with a high margin, but the number of units sold is not enough. You are puzzled why you cannot sell more. Try to find out why they’re not selling — could they be better described or more prominently placed on your menu? Have you considered free samples or trained your crew to upsell? Promoted more on social media? Or, it might be that the price tag is a little too high. Sometimes, lowering prices slightly can increase popularity enough to induce higher profits. With Puzzles, margins are high and demand seems to be the problem. In such a case, more advertising makes sense, as long as it is part of the long-term branding strategy.
Horse: High Demand & Low Margin.
Horses are probably the easiest to fix pull up your TLC. These items are already established and popular so the only thing that requires maintenance is the margin. Almost the only option to fix this item is to reduce cost. Sourcing cheaper ingredients, buying bulk, and using this item as bait paired combos with a high margin item i.e. puzzle. Is there any leftover on customers' plates? Portion Control would be an acceptable answer. Is cooking time required? Save time and do not offer well done without request. Remember, these babies are in high demand, so every penny saved adds up.
Dog: Low Demand & Low Margin.
Ah, the dreaded dogs. Unlike their fluffy counterparts, these ones are more bark than bite. Most of the time, it's best to bid them adieu. Repairing these items? It's like trying to teach an old dog new tricks—costly and time-consuming.
Menu engineering doesn't have to be a headache. With a little know-how and some savvy strategy, you'll be boosting profits in no time. Ready to unleash the power of your menu? Let's do this!
Menu Engineering Essentials for Maximized Profit
Ready to dive into the nitty-gritty of menu engineering? Here's what you need:
- Analysis Time Frame
- Product Cost (this is a must!)
- Product Sale Price
- Units Sold (Demand)
- Categorize every Item into
- Star (High Demand, High Contribution Margin)
- Horse (High Demand, Low Contribution Margin)
- Puzzle (Low Demand, High Contribution Margin)
- Dog (Low Demand, Low Contribution Margin)
Analysis Time Frame
When diving into menu engineering, start by defining your analysis time frame. This isn't about how long it takes to do the analysis, but rather the period over which your sales data is collected. Think of it as segmenting your sales data into time series. Later, we'll explore how this helps pinpoint where each product stands in its life cycle
Product Cost
This step is make-or-break for your business's success. Yes, it's a bit of a grind at first, but getting your product costs spot-on is crucial. No more eyeballing it—conduct real tests, master portioning, and watch those costs fall into place. Don't forget to include labor costs and preparation time in your calculations. The variance in the cost due to portioning makes the food cost between 15% to 50%. Immediately after correctly running product costing many managers find hidden "leaks" and waste once they get this step right.
Product Sale Price & Units Sold
The data you need for this step is already at your fingertips, tucked away in your log files. But here's the kicker: don't overlook the details. Take into account discounts, promotions, and any other factors that might impact sales numbers.
How Often to Run Menu Engineering
Menu engineering isn't a set-it-and-forget-it deal. It's a dynamic process that requires regular attention. Here's a rundown of when to roll up your sleeves and dive back in:
The benefits of Menu Engineering go way beyond profit maximization it opens the managers' eyes to the dynamics of their business and gives them much-needed control.
Frequency of performing Menu Engineering:
- Before printing menus
- Prior to launching new items
- Before peak season hits
- After an economic crisis, inflation, long term supply prices increase
- At least once a year for a comprehensive check-up
By sticking to these guidelines, you'll keep your menu fine-tuned for maximum profitability. Ready to take your menu to the next level? Let's get started
Appetizers Menu Engineering Real-Life Example
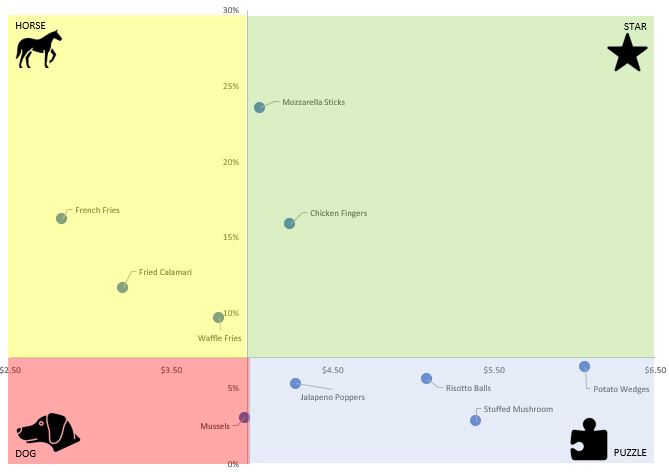
Ever wondered what it takes to whip up a winning appetizer menu? Let's dive into a real-life case study that spills the beans. We had the permission to publish so here is a Real-Life Product Mix of restaurant appetizers after the 1st round of optimization.
Picture this: a jam-packed appetizer menu boasting a whopping 10 items. But here's the scoop—according to Miller's Cognitive Limitation, the sweet spot is 5 to 7 items. Why? Because our brains can only juggle around 7 items, give or take a couple. Keep it simple, keep it memorable.

Menu Engineering Operations Optimization
Behind the Scenes Discussions
Now, let's peel back the curtain on some juicy discussions with our savvy customer:
- Calamari: A Horse with potential. How do we turn it into a Star? Easy—bump up the price by a mere 10 cents. Trust us, customers won't bat an eye, but your profits? They'll soar. Shoot for the stars with a price tag of $9.95 or even $10.45.
- Mussels: A Dog in disguise. Low demand, low margins—ouch. The verdict? Unless there's a compelling reason to keep 'em, they're out. But if you're dead set on keeping them, brace yourself for a makeover: jack up the price, trim costs (if possible), pump up the advertising, and fine-tune that recipe.
- Potato Overload: French Fries, Waffle Fries, Loaded Potato Wedges—talk about spud cannibalizing overload. Time to trim the fat. Can we consolidate? Pick one, maybe two at most. Both French Fries and Waffle Fries are Horses, meaning they're eating into each other's profits. Tough call, but a necessary one. Remember, a price increase is almost impossible as these are considered to be commodities.
And there you have it—the secret sauce to menu success. Menu engineering isn't just about tweaking prices or shuffling items around. It's about understanding the ebb and flow of your menu, anticipating customer cravings, and staying one step ahead of the game. That's why the best in the biz aren't just managers—they're leaders, charting the course for culinary greatness. Ready to join the ranks of the menu maestros? Let's make it happen.
Product Life Cycle
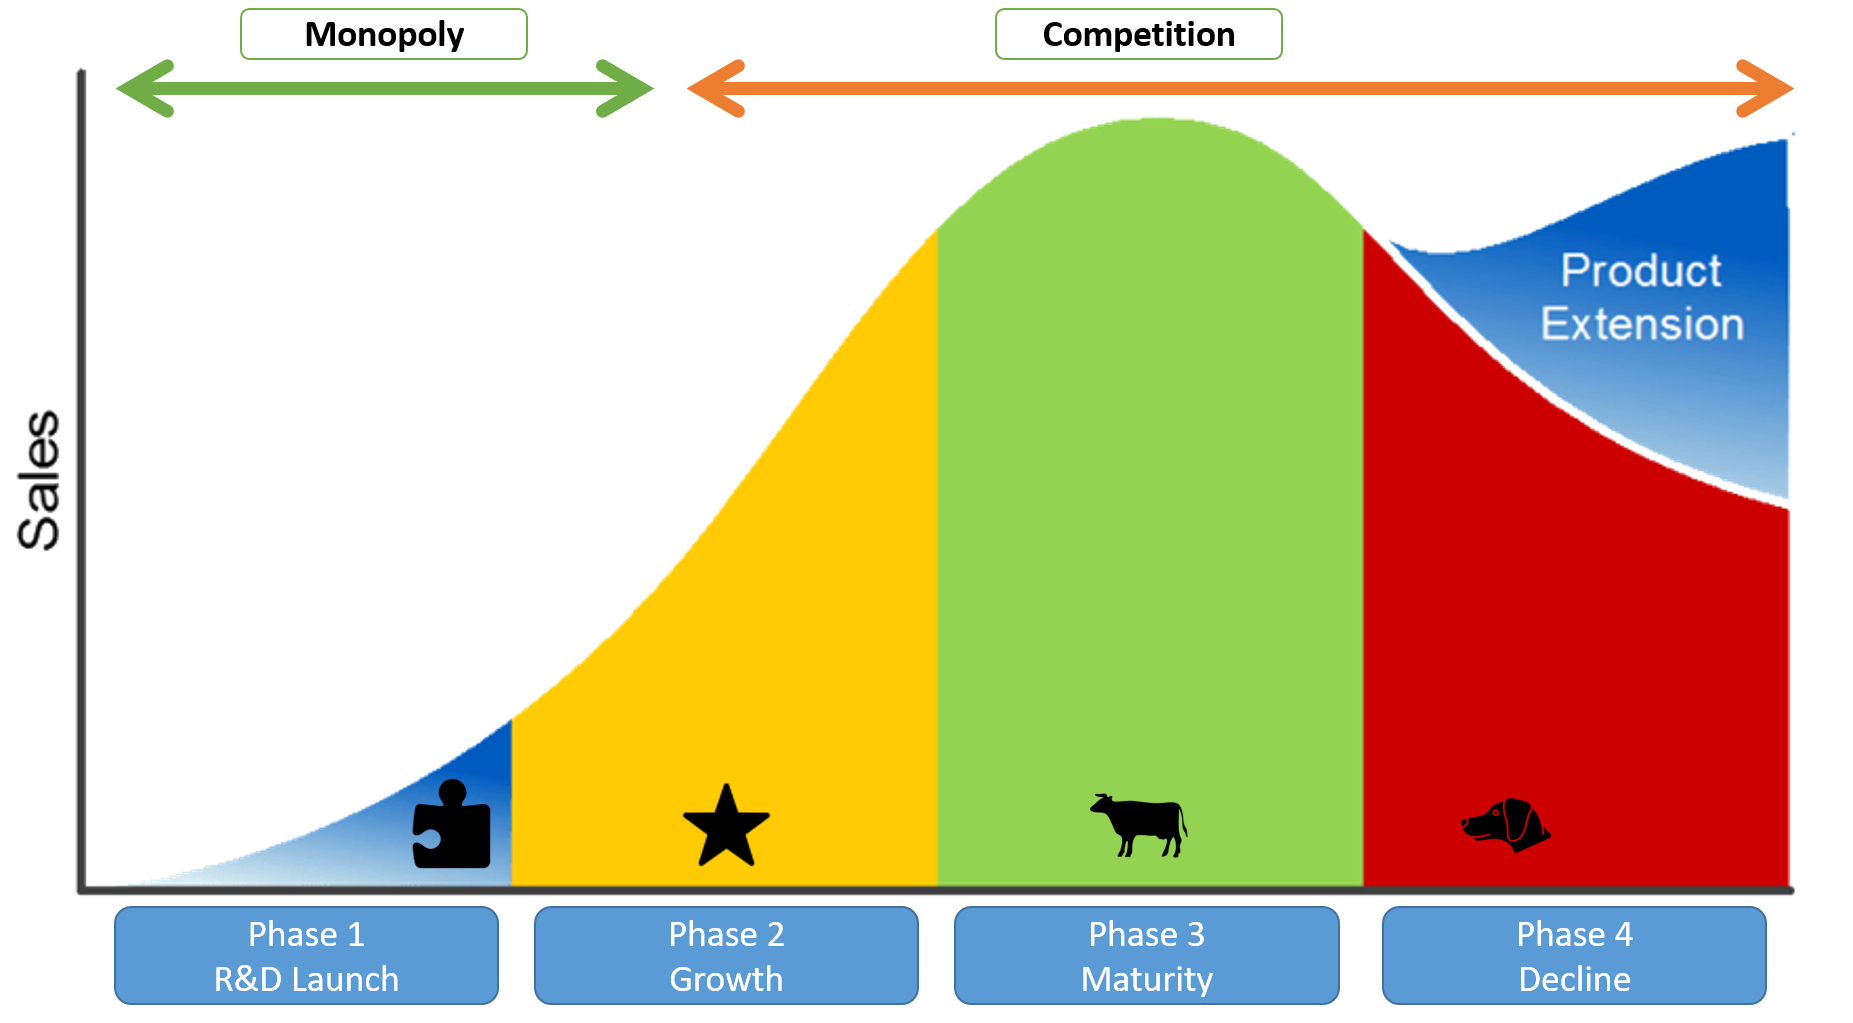
Ever pondered how products evolve over time? Let's peel back the curtain on the mysterious world of product life cycles. While there's a ton to unpack, we'll focus on the essentials to keep things crystal clear.

General Product Life Cycle Phases Curve
1. The Concept Unveiled
Picture this: the elusive product life cycle. It's a hot topic, with countless articles exploring strategies for each stage. But what's missing? A clear-cut mechanism to gauge where a product stands. We're here to shed light on this crucial concept, starting with the basics and promising a deeper dive in future articles.
2. Analyzing the Math Behind Growth
Now, let's zoom in on what really matters: spotting phase 2 growth products. Math might seem daunting, but fear not—we're breaking it down. First stop? Linear regression, and curve fit, and a little something called the Coefficient of Determination or R2.
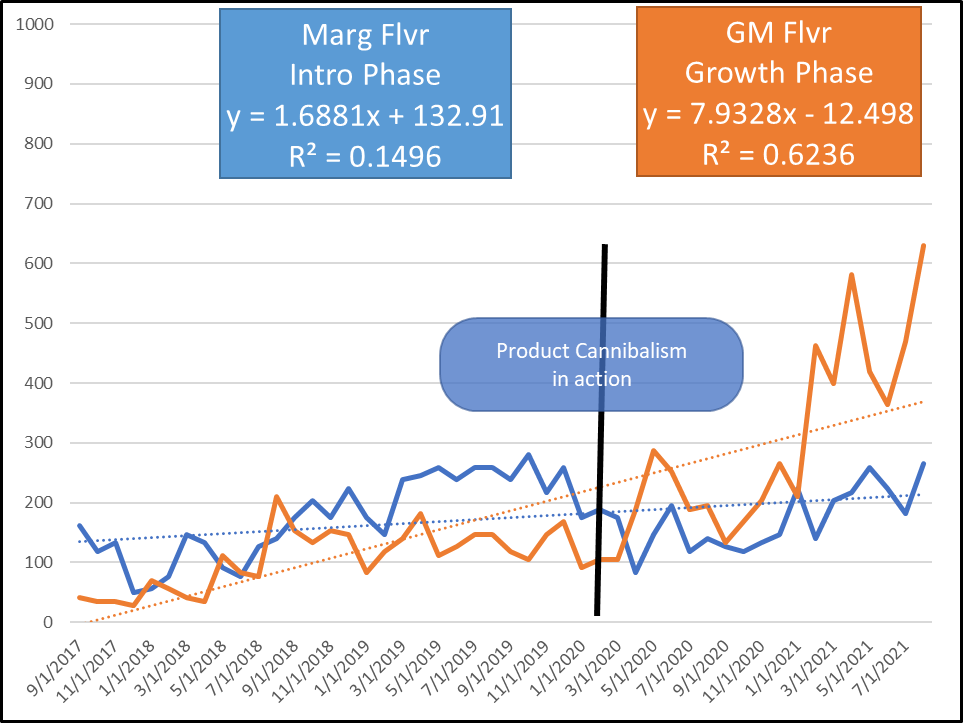
Typically, during the initial introductory phase (1) a product must be fitted with a positive slope linear curve. After a given time frame, good marketing, and professional SEO campaign, if the product demand does not accelerate to a hockey stick (Shape) or exponential growth, then that product needs to be eliminated or re-engineered.
3. Deciphering the Data
Take a peek at our local pizza joint. We're comparing demand for Grandma (GM) and Margarita (Marg) pizzas. Both are served up under the same conditions to the same crowd. The verdict? Grandma's pizza steals the show, outselling Margarita by a landslide—4 to 1, to be exact.
But here's the twist: Margarita pizzas are cheaper to produce (much greater margin), yet Grandma's reigns supreme in demand. The secret sauce? Smart SEO tactics and strategic menu engineering. Grandma's pizza not only drives more sales but also boosts Customer Lifetime Value - Branding and Loyalty.

Product Life Cycle of Equivalent Products
Not finished yet, the graph also shows a real-life case of product cannibalism. Right where we draw the line, someone can see that while the owner was promoting the Margheritas the demand was slowly declining while the demand for the GM was picking up.
4. Growth Model Testing
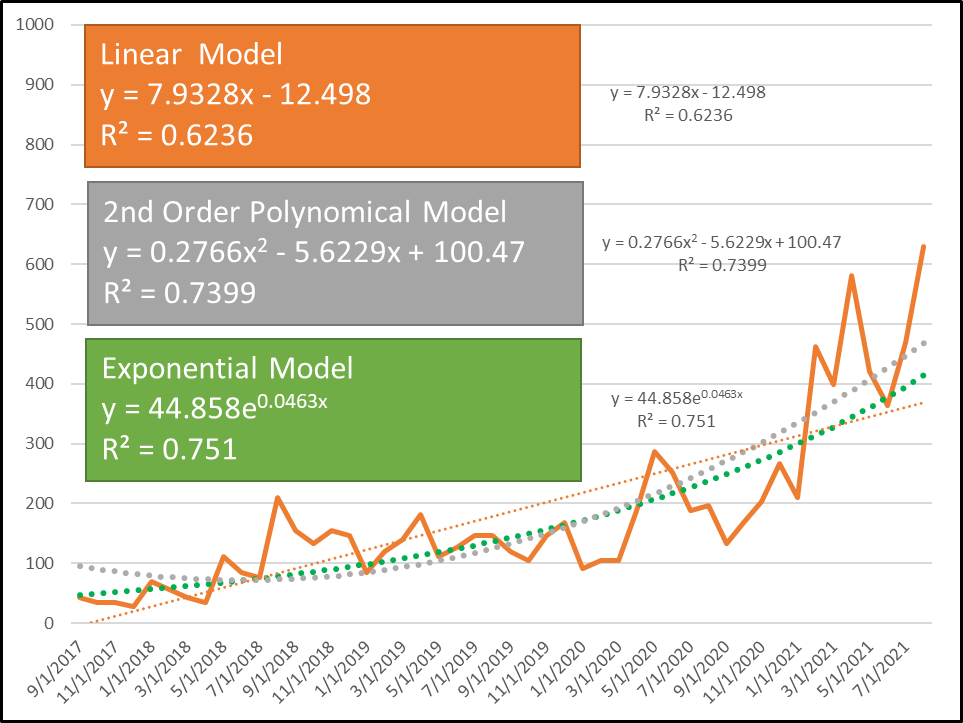
We're not stopping there. We've put Grandma's pizza through the wringer, testing it against linear, 2nd order polynomial, and exponential growth models. The result? An exponential growth story with an impressive R2 value of 0.751—beating out even the mighty polynomial model. Talk about a star performer!

Product Life Cycle Growth Phase Equation
5. Business Intelligence Unveiled
Armed with robust mathematical evidence, we've crowned Grandma's pizza a menu engineering star and a BCG cash cow. But here's the kicker: this isn't just theory—it's real-world data, untainted by the COVID-19 pandemic's impact.
6. Charting the Course Ahead
Visionary business owners, take note: mastering these concepts is key to navigating the turbulent waters of business. Dashboards and algorithms are your compass, guiding you toward success. While these graphs were handcrafted, the future lies in automation—sorting through hundreds or thousands of products with ease.